Wardrobe analytics
Your closet,
by the numbers.
Cost-per-wear on every piece, the clothes you never reach for, and how your palette is shifting — read back to you each week like editorial, not a spreadsheet.
Get Early Access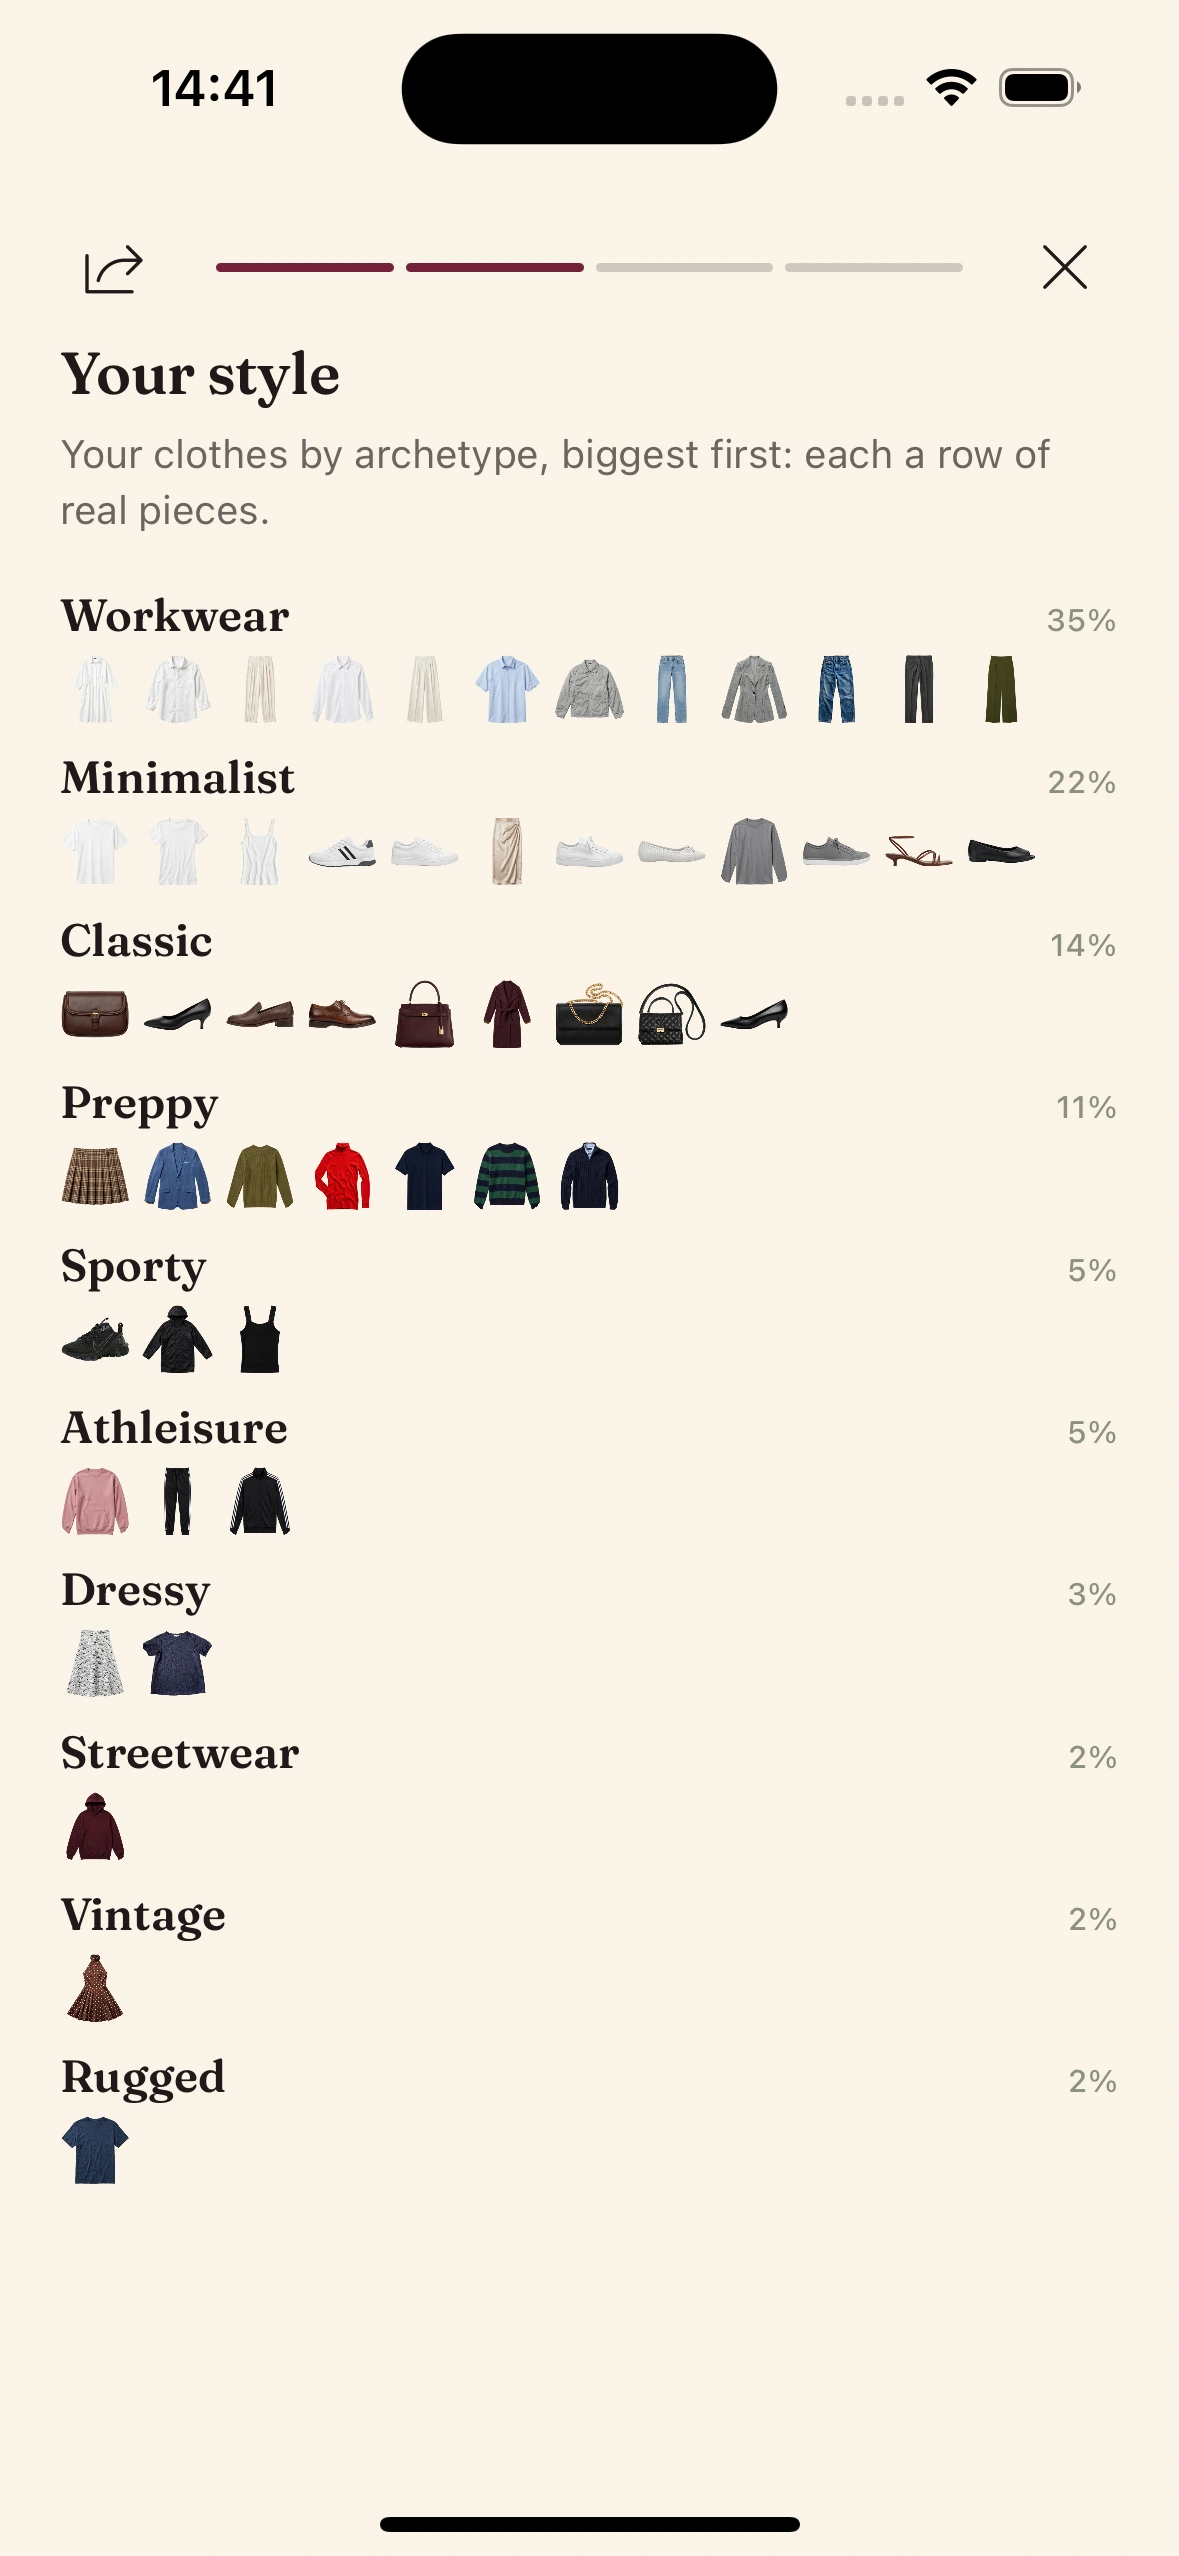
How the numbers add up
Wear and log
Every fit you wear gets logged — a daily fit you tapped, an event on your connected calendar, or a quick manual mark. No spreadsheet, no data entry. Wearing your clothes is the input.
The math runs itself
Clottr divides each item's price by the wears it has racked up, counts how often you reach for it, and clocks how long it has sat untouched — per piece, automatically.
The recap, weekly
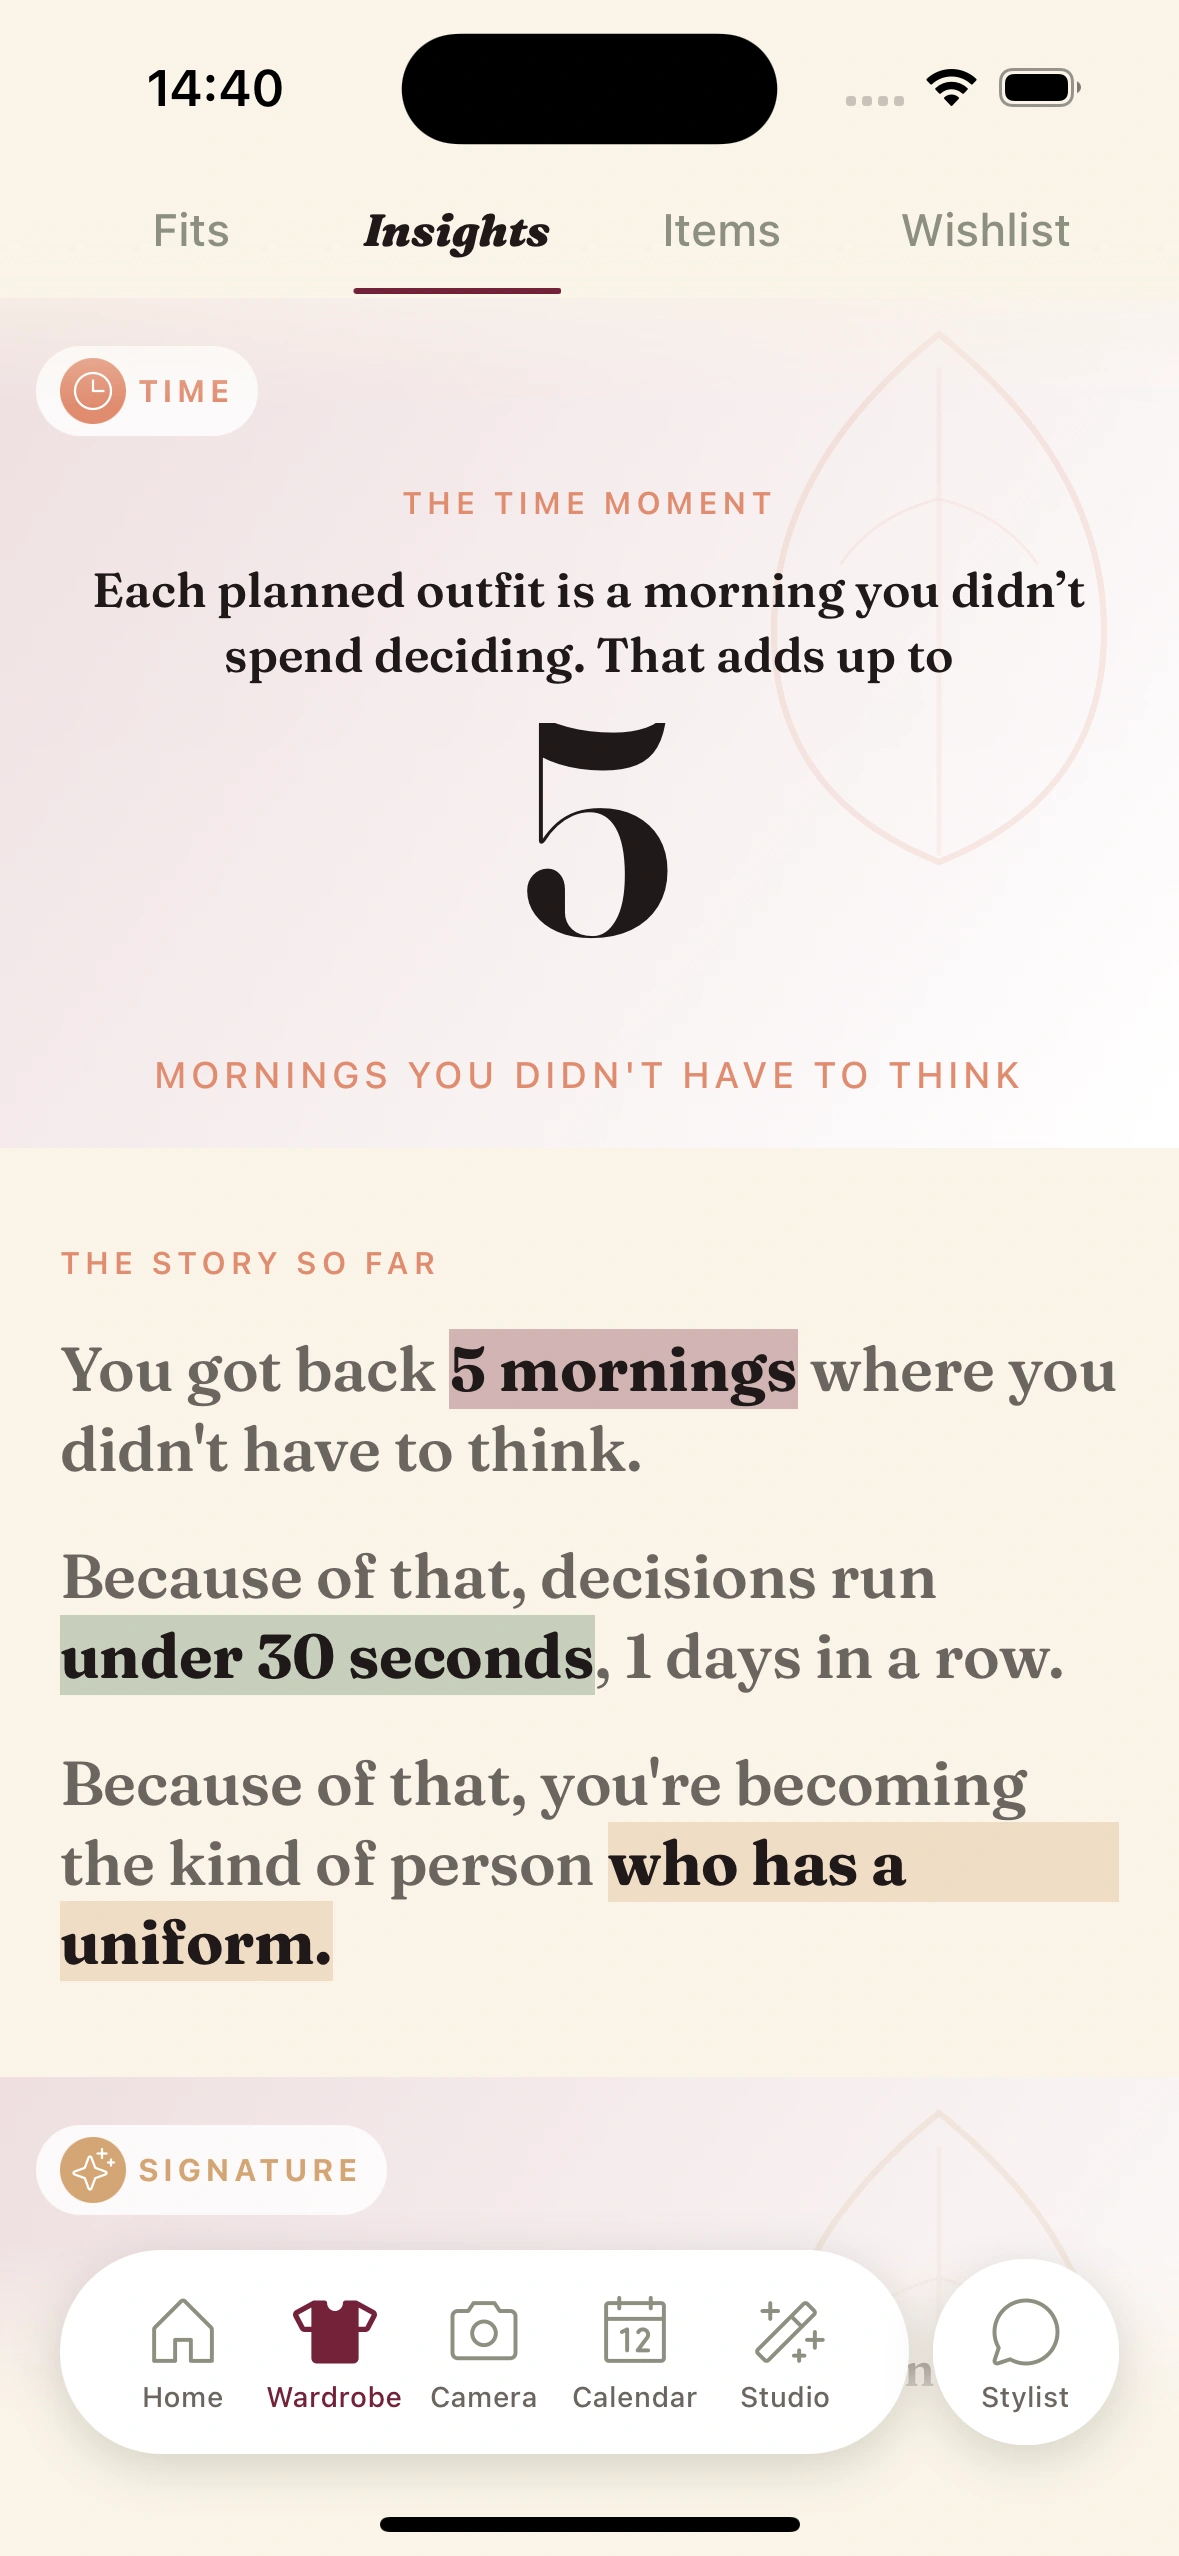
Once a week the Insights tab reads your closet aloud — palette shifts, deep cuts, peer percentiles — in the voice of a stylist with a copyeditor, not a dashboard.
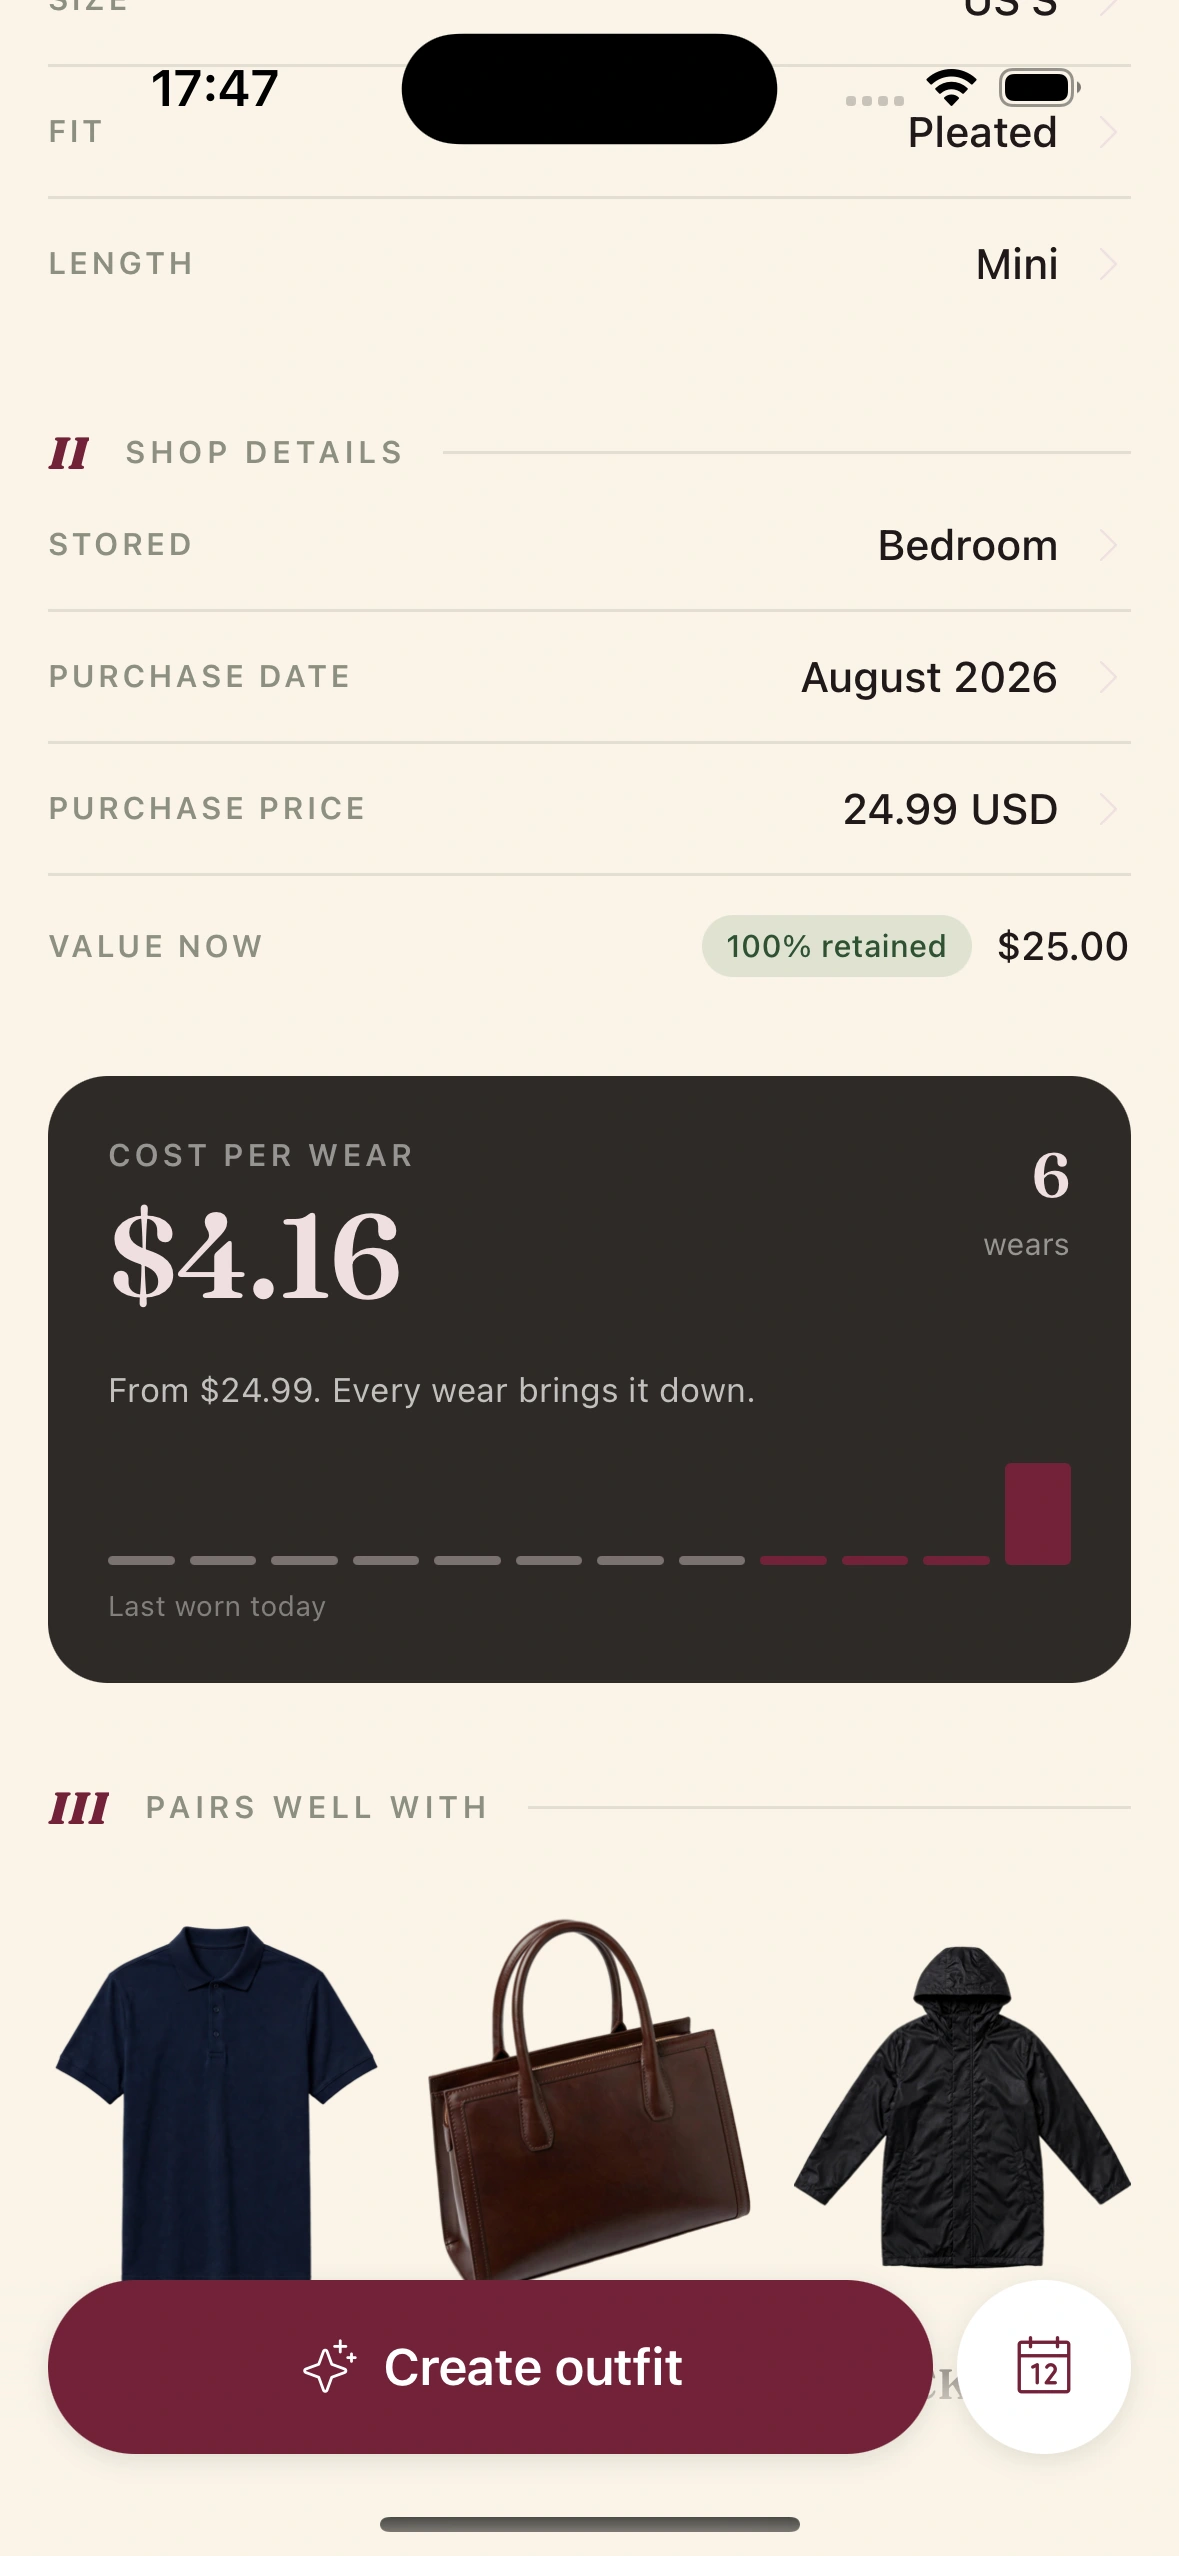
Cost-per-wear, on every hanger
Cost-per-wear is the honest number: an item's price divided by how many times you actually wore it. Clottr tracks it per piece and updates it every time you dress, so that $120 blazer quietly drops below $4 a wear while the impulse-buy heels stay stuck at $95.
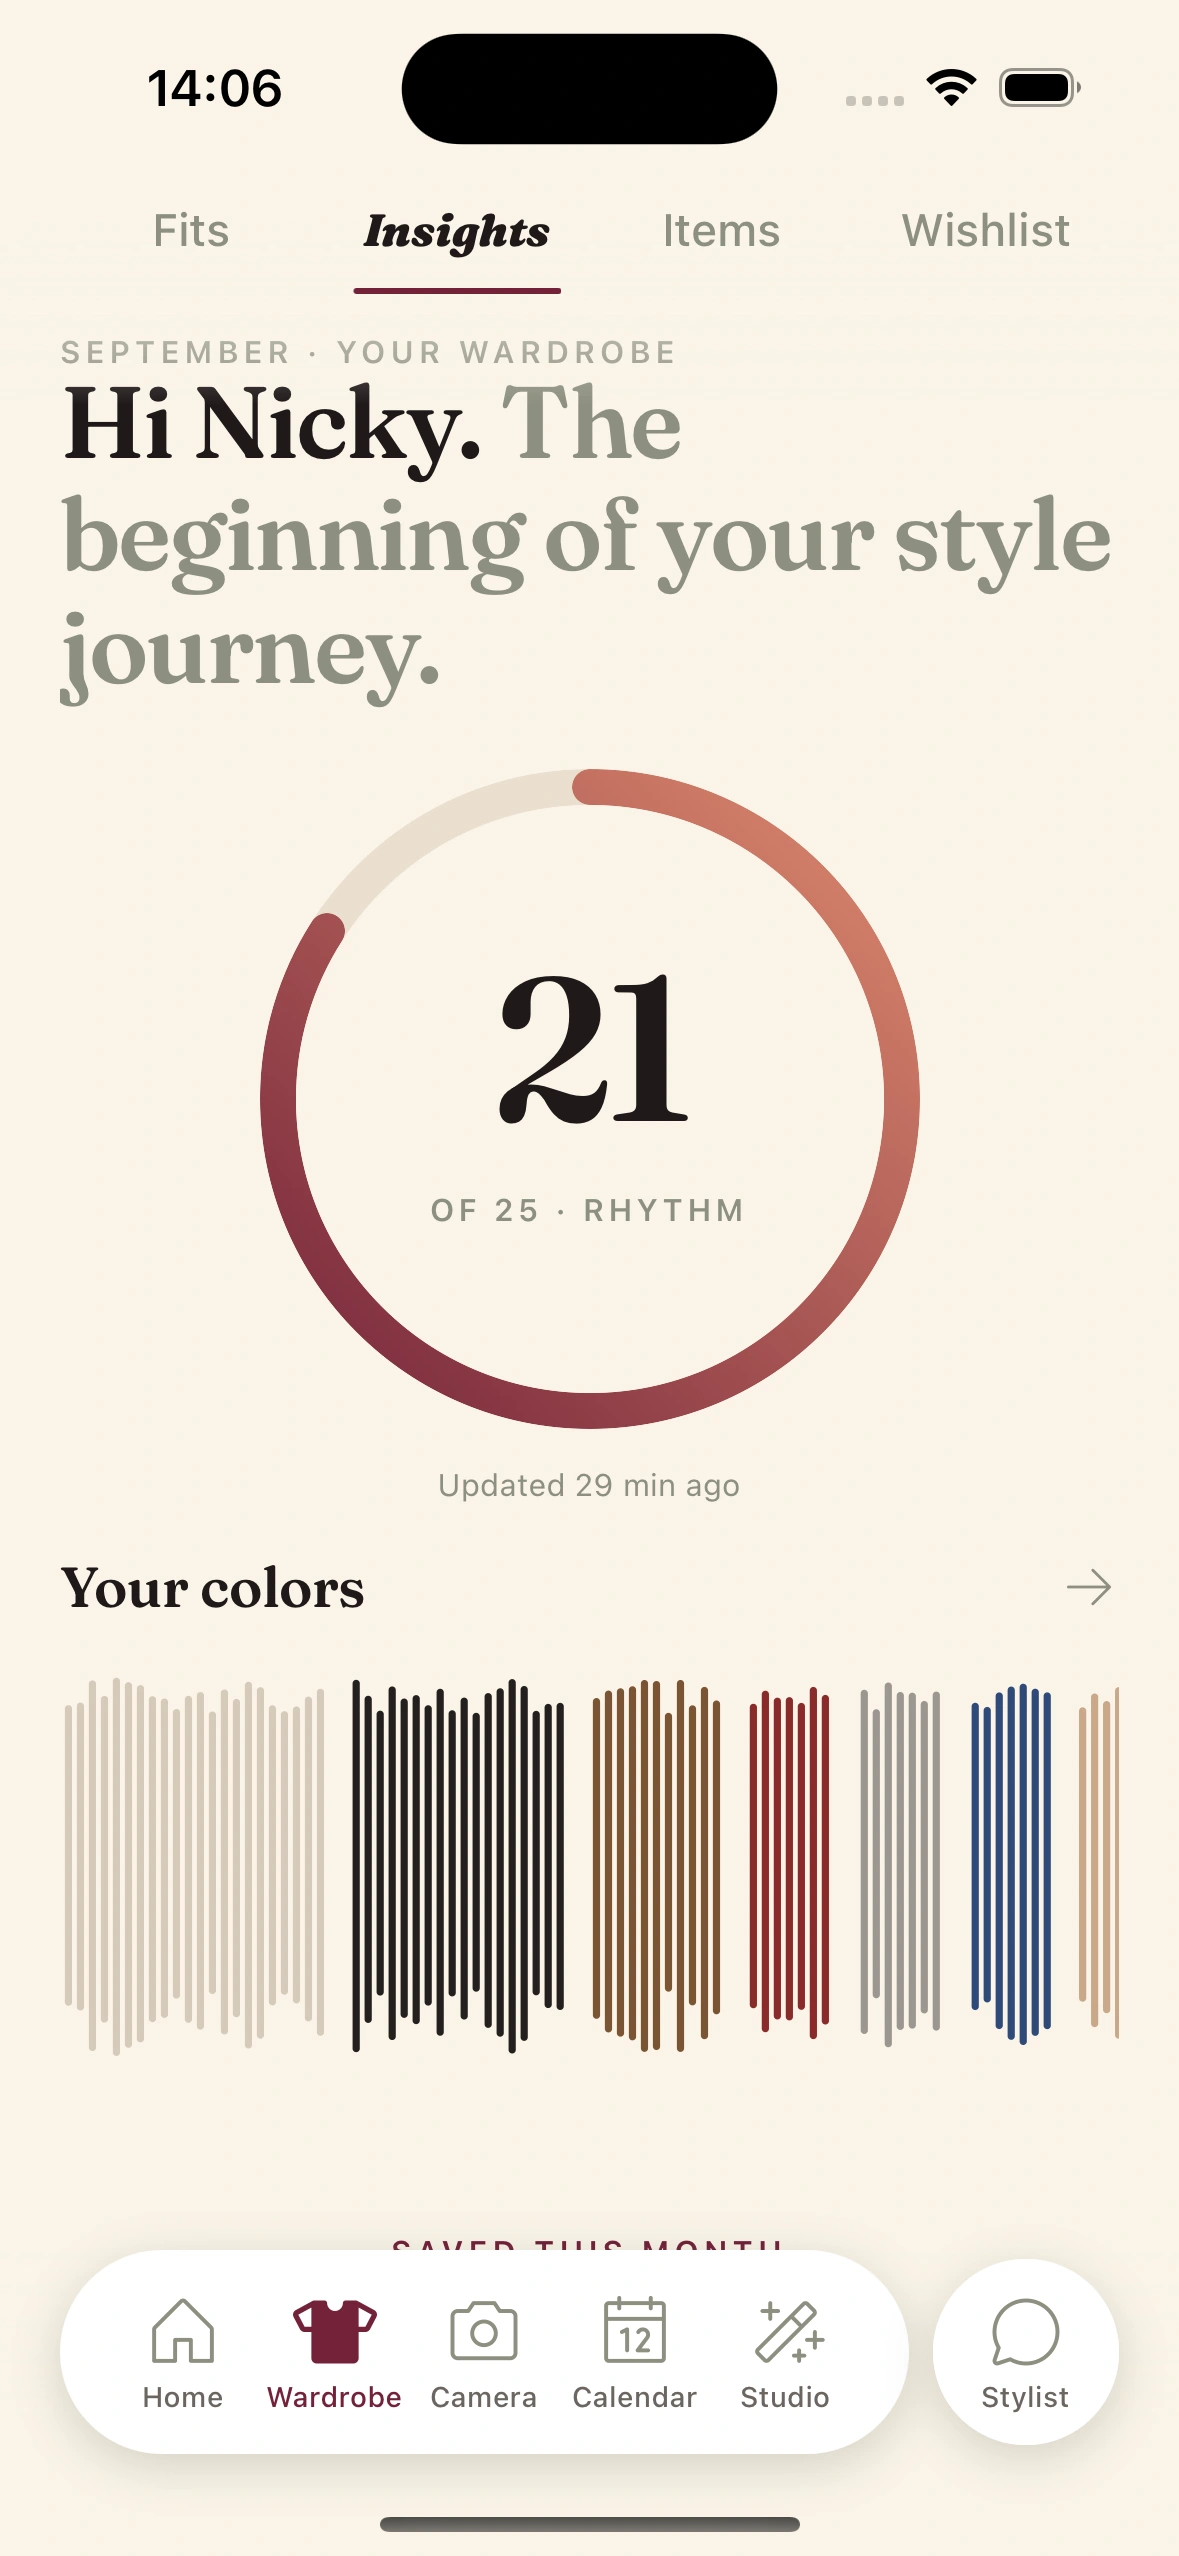
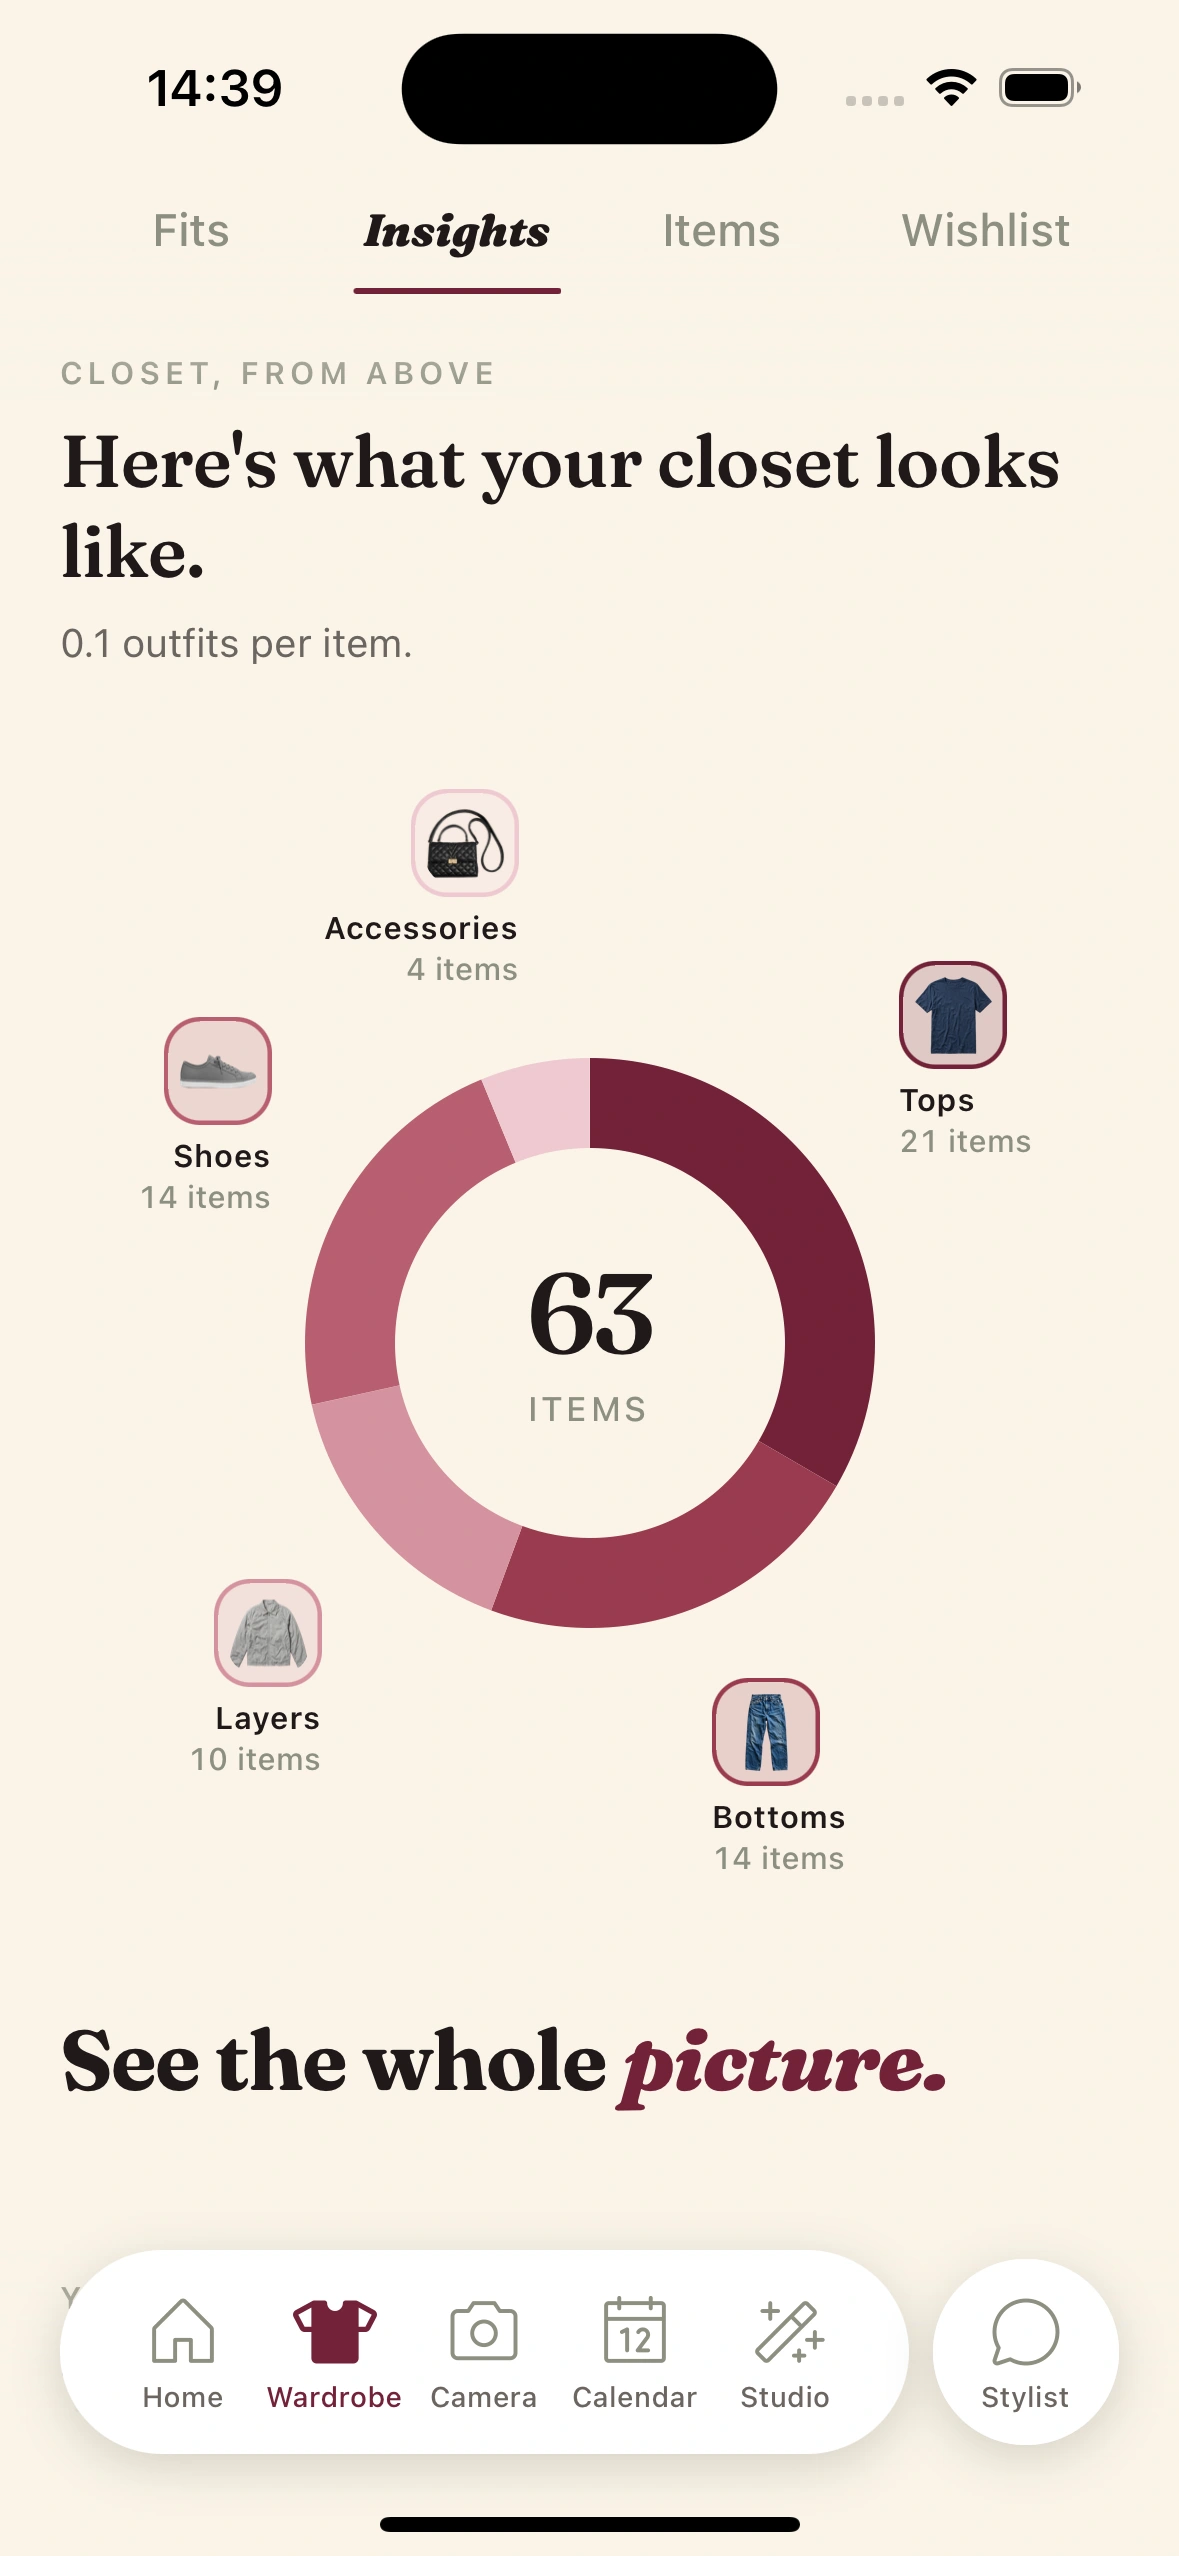
Alongside it sits the rest of the picture — which pieces you reach for, which you never do, and how your palette is drifting week over week. Closet statistics, without the tax software feel.
- ·Most-worn this week
- ·Longest untouched
- ·Cost-per-wear per item
- ·Palette by color family
- ·Style mix over time
- ·Wears logged per season
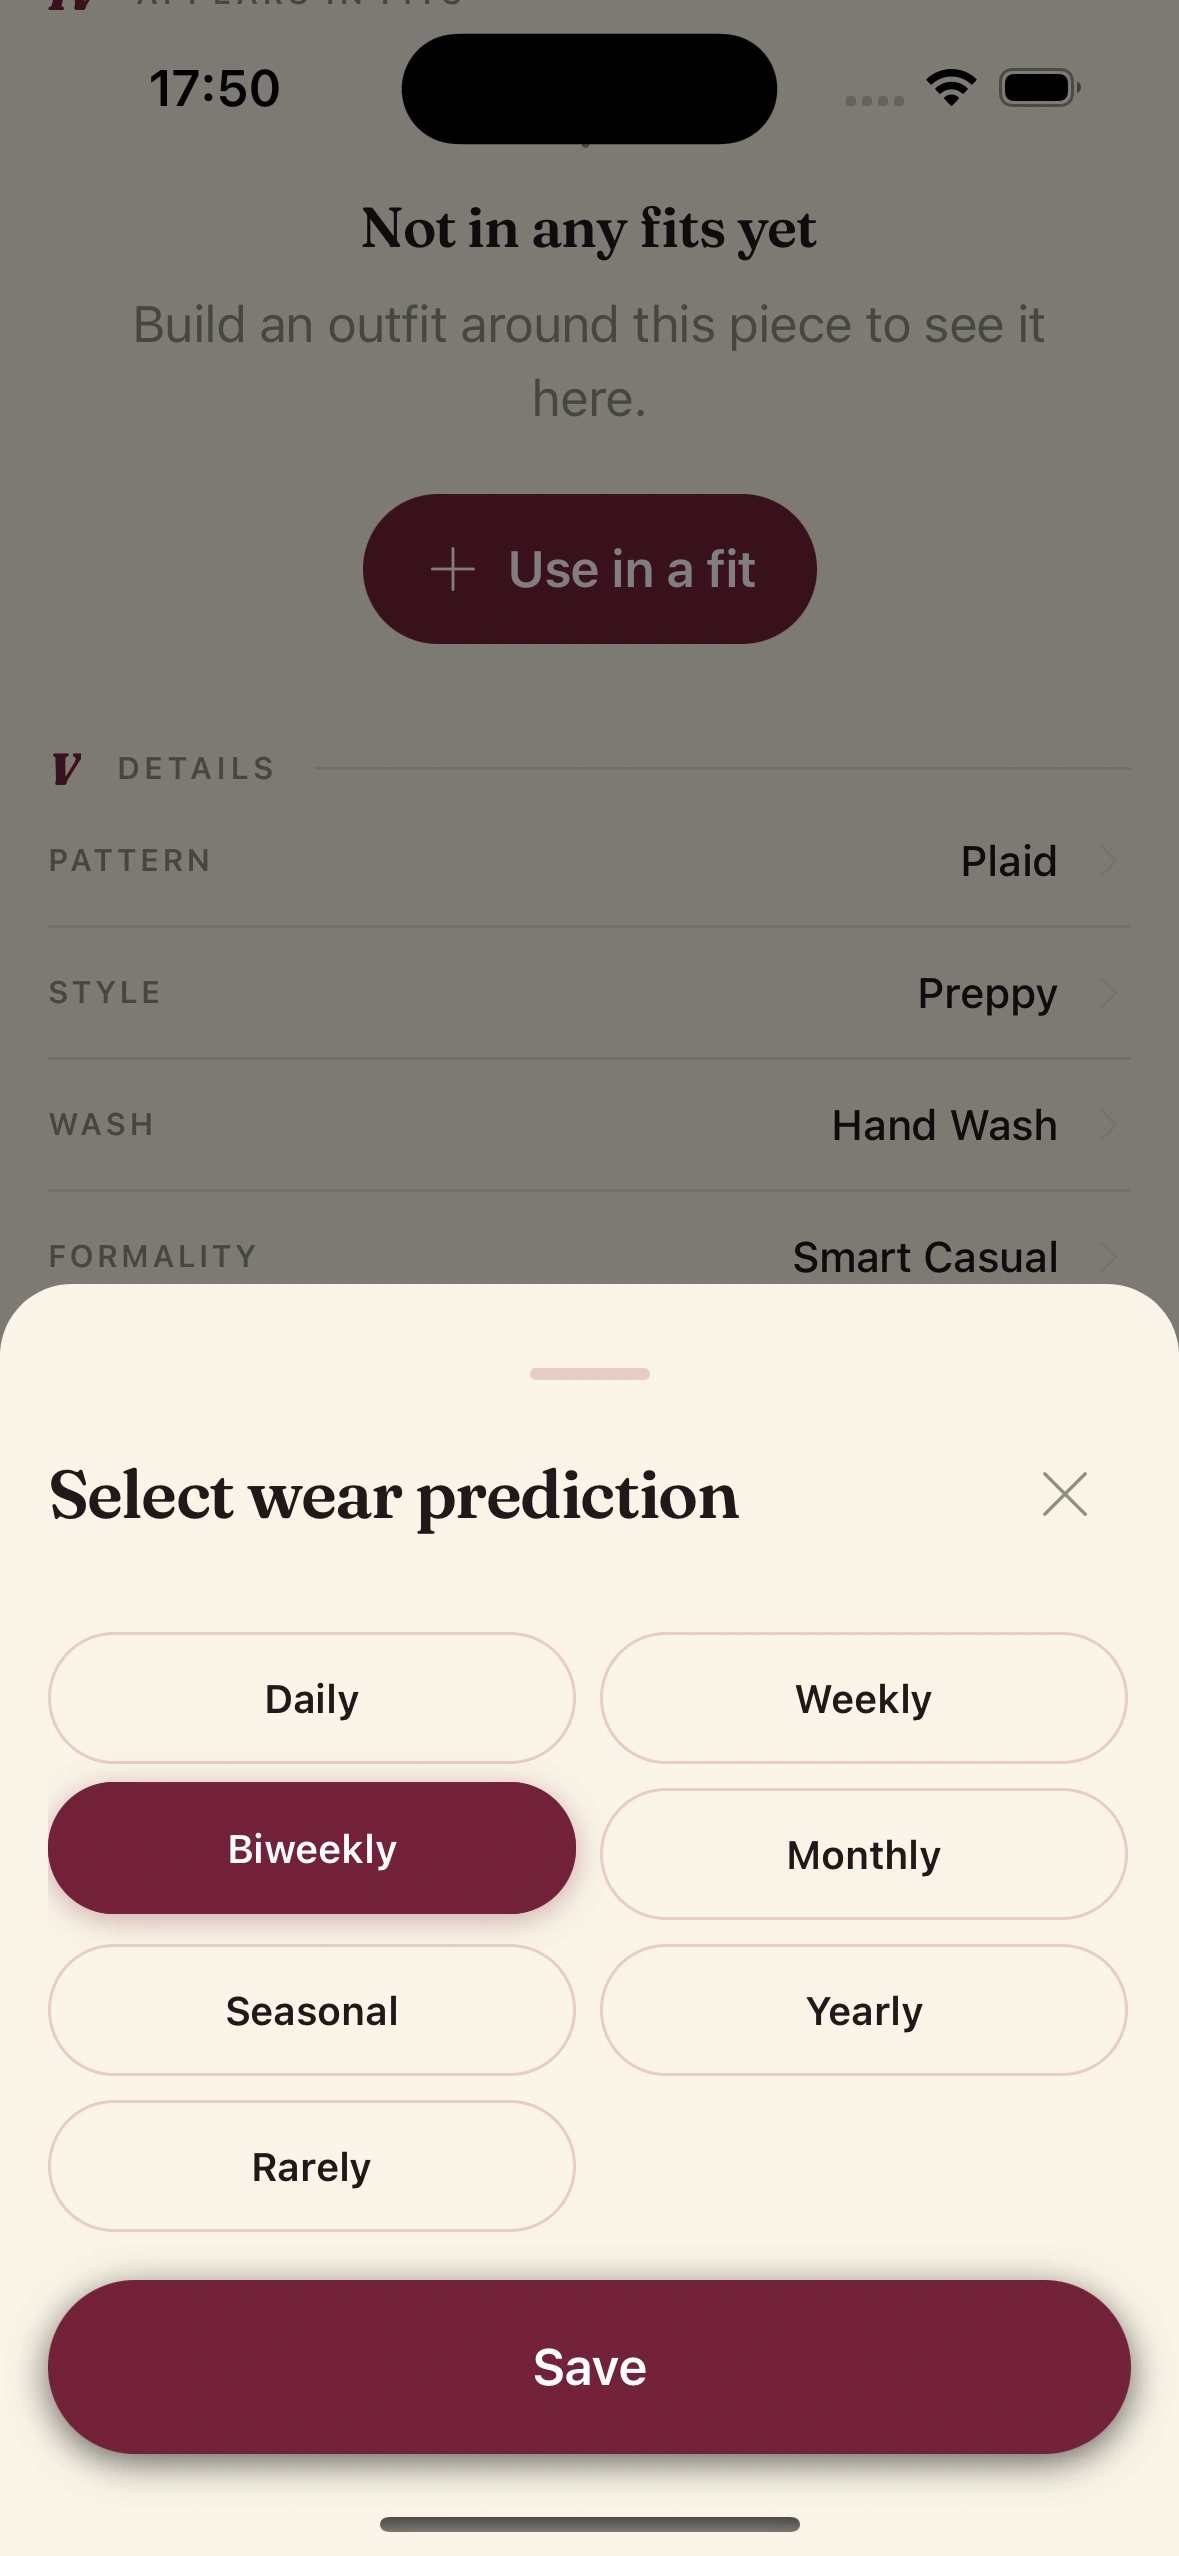
Tracks your wears. Automatically
Don't feel like tracking each wear every day? No worries, by setting wear prediction frequency, we will automatically keep track of your wears. All aligned to the fits you like and choose.
Daily we update all clothes that you have probably worn that day, taking into account season, fits, any events or trips to make sure your statistics is up to date. Automatically.
Frequently Asked Questions
How do I track cost per wear?
Cost-per-wear is an item's price divided by how many times you've worn it. Clottr logs your wears automatically from frequency prediction, daily fits and calendar events (or a manual tap), then tracks the number per piece, so you can watch a $120 blazer fall below $4 a wear while a rarely-touched item stays expensive.
Which clothes do I never wear?
Insights surfaces your "deep cuts", the pieces sitting untouched the longest and resurfaces them when the weather and your week finally suit. In practice it reads like "the olive overshirt hasn’t been worn in 92 days, and today is finally right."
What wardrobe analytics does Clottr show?
Your closet by the numbers: most- and least-worn pieces, cost-per-wear per item, how your color palette is shifting week over week, your overall style mix, and wears logged per season. Every statistic updates as you wear, so it stays current instead of frozen at setup.
How does Clottr know which clothes I actually wear?
Three sources feed it: the daily fits you tap to wear, events on a connected calendar, and any wear you log by hand. Nothing needs a spreadsheet, the act of wearing your clothes is what fills the numbers in.
What are peer percentiles, and can I share my recap?
Some stats compare you anonymously against other Clottr users — like "you’re in the top 12% for color play this month." Each weekly recap also becomes a share card you can post or keep private. Your wardrobe data stays yours either way; only aggregate, anonymized rankings are compared.
Explore more
Digital Wardrobe
The searchable closet the insights are built on — snap or import every piece.
AI Outfit Planner
The daily fits that log your wears and feed cost-per-wear automatically.
Guide: Read Your Insights
A walkthrough of every card — palette, deep cuts, percentiles, and CPW.
"My closet wrote me a love letter"
What a real weekly recap reads like, from the hero line to the deep cuts.